After signing a huge deal with the Angels, Pujols has been having a really bad year. He hasn't hit a home run this year, breaking a career long streak. So I thought it would be a good idea to use some statistics to tell how good or bad we think Pujols will actually be this year.
Coming into the year, he had a career .328/.420/.617 career AVG/OBP/SLG. Through one month, he has a .194/.237/.269. So what do we expect out of Pujols for the rest of the year?
In Bayesian statistical terms, we can quantify our prior beliefs about Pujols from his history before this year. Below are histograms and fitted distributions of Pujols' yearly batting lines from 2001 to 2011. His numbers are well above normal and he has been the best player in baseball for a while.
 So coming into this year, we would expect him to have a batting average between .290 and .370, with .330 being the most likely, for example.
Combining our prior expectations with the data we have observed from this year, we can get our posterior beliefs. When we do that, we get a posterior expectation that Pujols is a true .312/.379/.451 hitter. The league averages from 2001 to 2011 are .263/.331/.418, so he is still expected to be well above the average player, even with the poor start. If we use data from just this year, we do not have enough data to give us an accurate reflection of how good he is. If we combine the data with our prior beliefs, we get a better indication of what to expect. Below is a table that compares these numbers.
Finally, we can also get the whole posterior distribution (not just the expectation). I have plotted the prior and posterior distributions on the same graph. You can see that Pujols' bad month has caused our beliefs about him to decrease quite a bit. Most notable is the slugging percentage, which is likely because of his career-long homerless streak.
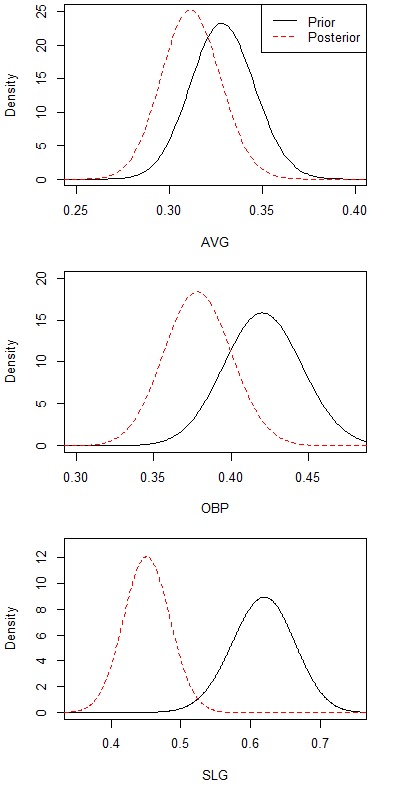
What Bayesian analysis does is shrinks (or regresses) the data from this year to the prior average. This is the same idea of regressing to the overall mean that is talked about frequently in sabermetric blogs. The difference is that regressing to the mean usually regresses to the average player in the league. With Bayesian analysis, we can regress to our prior expectation about the specific player (Albert Pujols). I believe this approach will give us better results in most cases.
The R code to do the analysis can be found here. I used data from Baseball Reference.
Coming into the year, he had a career .328/.420/.617 career AVG/OBP/SLG. Through one month, he has a .194/.237/.269. So what do we expect out of Pujols for the rest of the year?
In Bayesian statistical terms, we can quantify our prior beliefs about Pujols from his history before this year. Below are histograms and fitted distributions of Pujols' yearly batting lines from 2001 to 2011. His numbers are well above normal and he has been the best player in baseball for a while.
Combining our prior expectations with the data we have observed from this year, we can get our posterior beliefs. When we do that, we get a posterior expectation that Pujols is a true .312/.379/.451 hitter. The league averages from 2001 to 2011 are .263/.331/.418, so he is still expected to be well above the average player, even with the poor start. If we use data from just this year, we do not have enough data to give us an accurate reflection of how good he is. If we combine the data with our prior beliefs, we get a better indication of what to expect. Below is a table that compares these numbers.
| AVG | OBP | SLG | |
|---|---|---|---|
| League | .263 | .331 | .418 |
| Prior | .328 | .420 | .617 |
| This Year | .194 | .237 | .269 |
| Posterior | .312 | .379 | .451 |
Finally, we can also get the whole posterior distribution (not just the expectation). I have plotted the prior and posterior distributions on the same graph. You can see that Pujols' bad month has caused our beliefs about him to decrease quite a bit. Most notable is the slugging percentage, which is likely because of his career-long homerless streak.
What Bayesian analysis does is shrinks (or regresses) the data from this year to the prior average. This is the same idea of regressing to the overall mean that is talked about frequently in sabermetric blogs. The difference is that regressing to the mean usually regresses to the average player in the league. With Bayesian analysis, we can regress to our prior expectation about the specific player (Albert Pujols). I believe this approach will give us better results in most cases.
The R code to do the analysis can be found here. I used data from Baseball Reference.
Not sure what to make of this except to say he had a really bad start with slugging, which may have been caused more by random chance than the other two. And obviously the distributional assumptions are an approximation to reality.