Introduction
Matrix factorization has been proven to be one of the best ways to do collaborative filtering. The most common example of collaborative filtering is to predict how much a viewer will like a movie. The power of matrix factorization was a key development of the Netflix Prize (see http://www2.research.att.com/~volinsky/papers/ieeecomputer.pdf).Using the movie rating example, the idea is that there are some underlying features of the movie and underlying attributes of the user that interact to determine if the user will like the movie. So if the user typically likes comedies, and the movie is a comedy, these will interact and the user will like the movie. The best part is that in order to determine these features, we do not need to use any background information on the movie or the user. For example, we don't need someone to manually code whether each movie is a comedy or not. Matrix factorization just needs a set of historical ratings, which is usually easily available.
Using only a few features, we could probably interpret what each of them mean (comedy, drama, foreign, blockbuster, ...). They found in the Netflix competition that increasing the number of underlying features that make up a user and a movie almost always improved accuracy (they used up to 1500 features). With that many features, they can no longer be interpreted as in the example.
Baseball Data
I find this method interesting, and I wanted to apply it to some real data. One idea I had is predicting whether the result of a pitcher-batter match-up in baseball. Usually in baseball, the analysts cry "small sample size" if someone reports that a pitcher is particularly good/bad versus a batter. In order to get an accurate assessment that does not suffer from random variation, we need 100 or more at bats, which usually takes a few years at least.It seems that matrix factorization might be a natural fit, because we are not predicting the specific interaction of the batter/pitcher. Instead, we are estimating some underlying features of the batter and the pitcher. We can estimate these features from all of the match-ups that the batter and pitcher have been in -- not just the ones against each other.
One example of a feature that I hoped to extract is batter and pitcher handedness. It is well known that batters fair poorly against pitchers of the same handedness and do better against pitchers of the opposite handedness. Other examples might relate to whether the pitcher can throw fast and how well the batter does against fast pitches; similarly with breaking balls, etc.
In the Netflix competition, each user rates movies on a 1 to 5 star scale, and rates the movie only once. The outcome of a match-up is different as there is no obvious "rating" of the outcome. I used improvement in expected number of runs scored of the outcome of a plate appearance as the "rating" to be predicted (from here). So a single is worth 0.474 runs and an out is worth -0.299 runs. Also, in baseball, there will be many match-ups between the batter and pitcher. I could have averaged the outcomes, but I left the multiple records in the data as is.
I used 2010 data and removed all pitchers that were hitting and batters that were pitching. According to my data, there were 65,128 unique batter-pitcher match-ups (with about 173,000 plate appearances). I used 5,000 match-ups as validation, 5,000 as testing, and the remaining as training.
Model Fitting
The first model I used as a baseline just included "biases" for the batter and pitcher, as well as an overall league average bias. In the baseline, there are no factors or interactions. So the result of the match-up between a batter i and pitcher j would be estimated as the overall average bias plus the batter i bias plus the pitcher j bias. In math terms:Higher values for the batter bias mean the batter is better better than average and lower values for the pitcher bias means the pitcher is better than average.
So as to not overfit the data, I used L2 regularization on the batter and pitcher biases. For this and future estimation, I used the validation data to determine the best penalty and I used a gradient descent method to solve for the parameters.
Adding in the factor interaction, the result of the match-up between a batter i and pitcher j is
where
Results
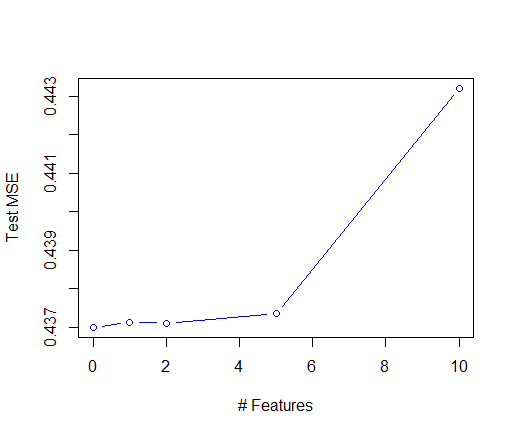
I fit the matrix factorization model using 0, 1, 2, 5, and 10 features. The model with 0 features corresponds to the baseline model. As stated above, I was hoping to see that handedness would show up as one of the first features.I fit the models with the training set, tuned the regularization parameters with the validation set, and finally I am comparing the models with the test set. Unfortunately, the baseline model performed the best of all and the performance degraded as more features were added. A plot of the test mean squared errors is below. The difference between the models is small, but I believe that is because the regularization parameter is shrinking the factor vectors to 0.
I compared the factor vectors of the pitchers by their handedness and I found no difference between righties and lefties.
Summary
The outcome of this analysis was not what I hoped for, but I still learned something about matrix factorization and its implementation. I think the moral of the story is that it is hard to predict batter-pitcher match-ups, probably because there is a lot of variation in every at bat. Matrix factorization has been successfully applied in situations where the data is much more sparse than this application, so this difference may be a reason for its failure. I plan to try this again with the libFM software to see if I get the same results.Update:
I implemented this in libFM and basically got the same results, so I guess I was doing it correctly. If I work on this further, I wonder if adding attributes about the pitcher explicitly would help. I would include an indicator for righty/lefty or maybe home/away.