Recently, Chris Perez, the closer for the Indians, displayed some frustration with the fans for not supporting the team. Currently, they have the lowest attendance in the majors -- by a decent margin. The Indians are averaging about 15,000 fans per home game, while the next closest team, the Oakland A's, is averaging 19,000. It seemed like an odd time for Perez to bring this up because they have had attendance in the 29,000s each of the last two home games. So that intrigued me to look into the numbers of what causes attendance to vary.
I looked at 2011 attendance data for the Cleveland Indians only. I had a strong suspicion that a popular opponent would definitely and weekend games cause attendance to increase. Also, there is usually some press at the beginning of the season that claims no one wants to go to the games because it is too cold for baseball. (There is also more competing entertainment at the beginning of the season.)
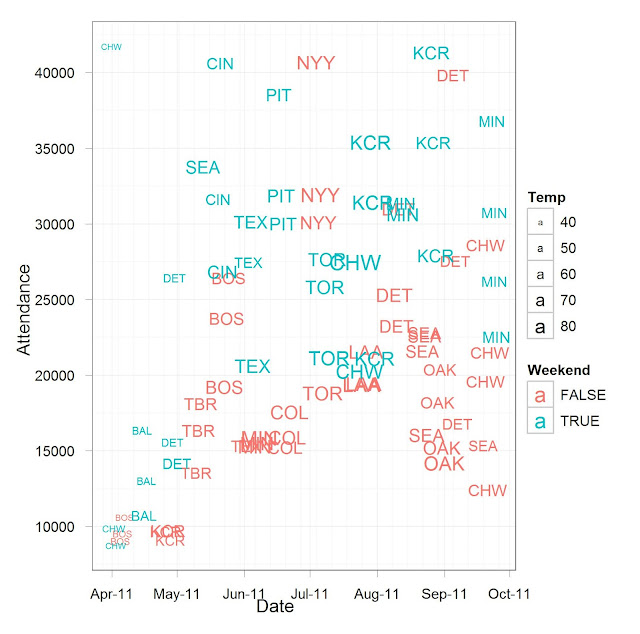
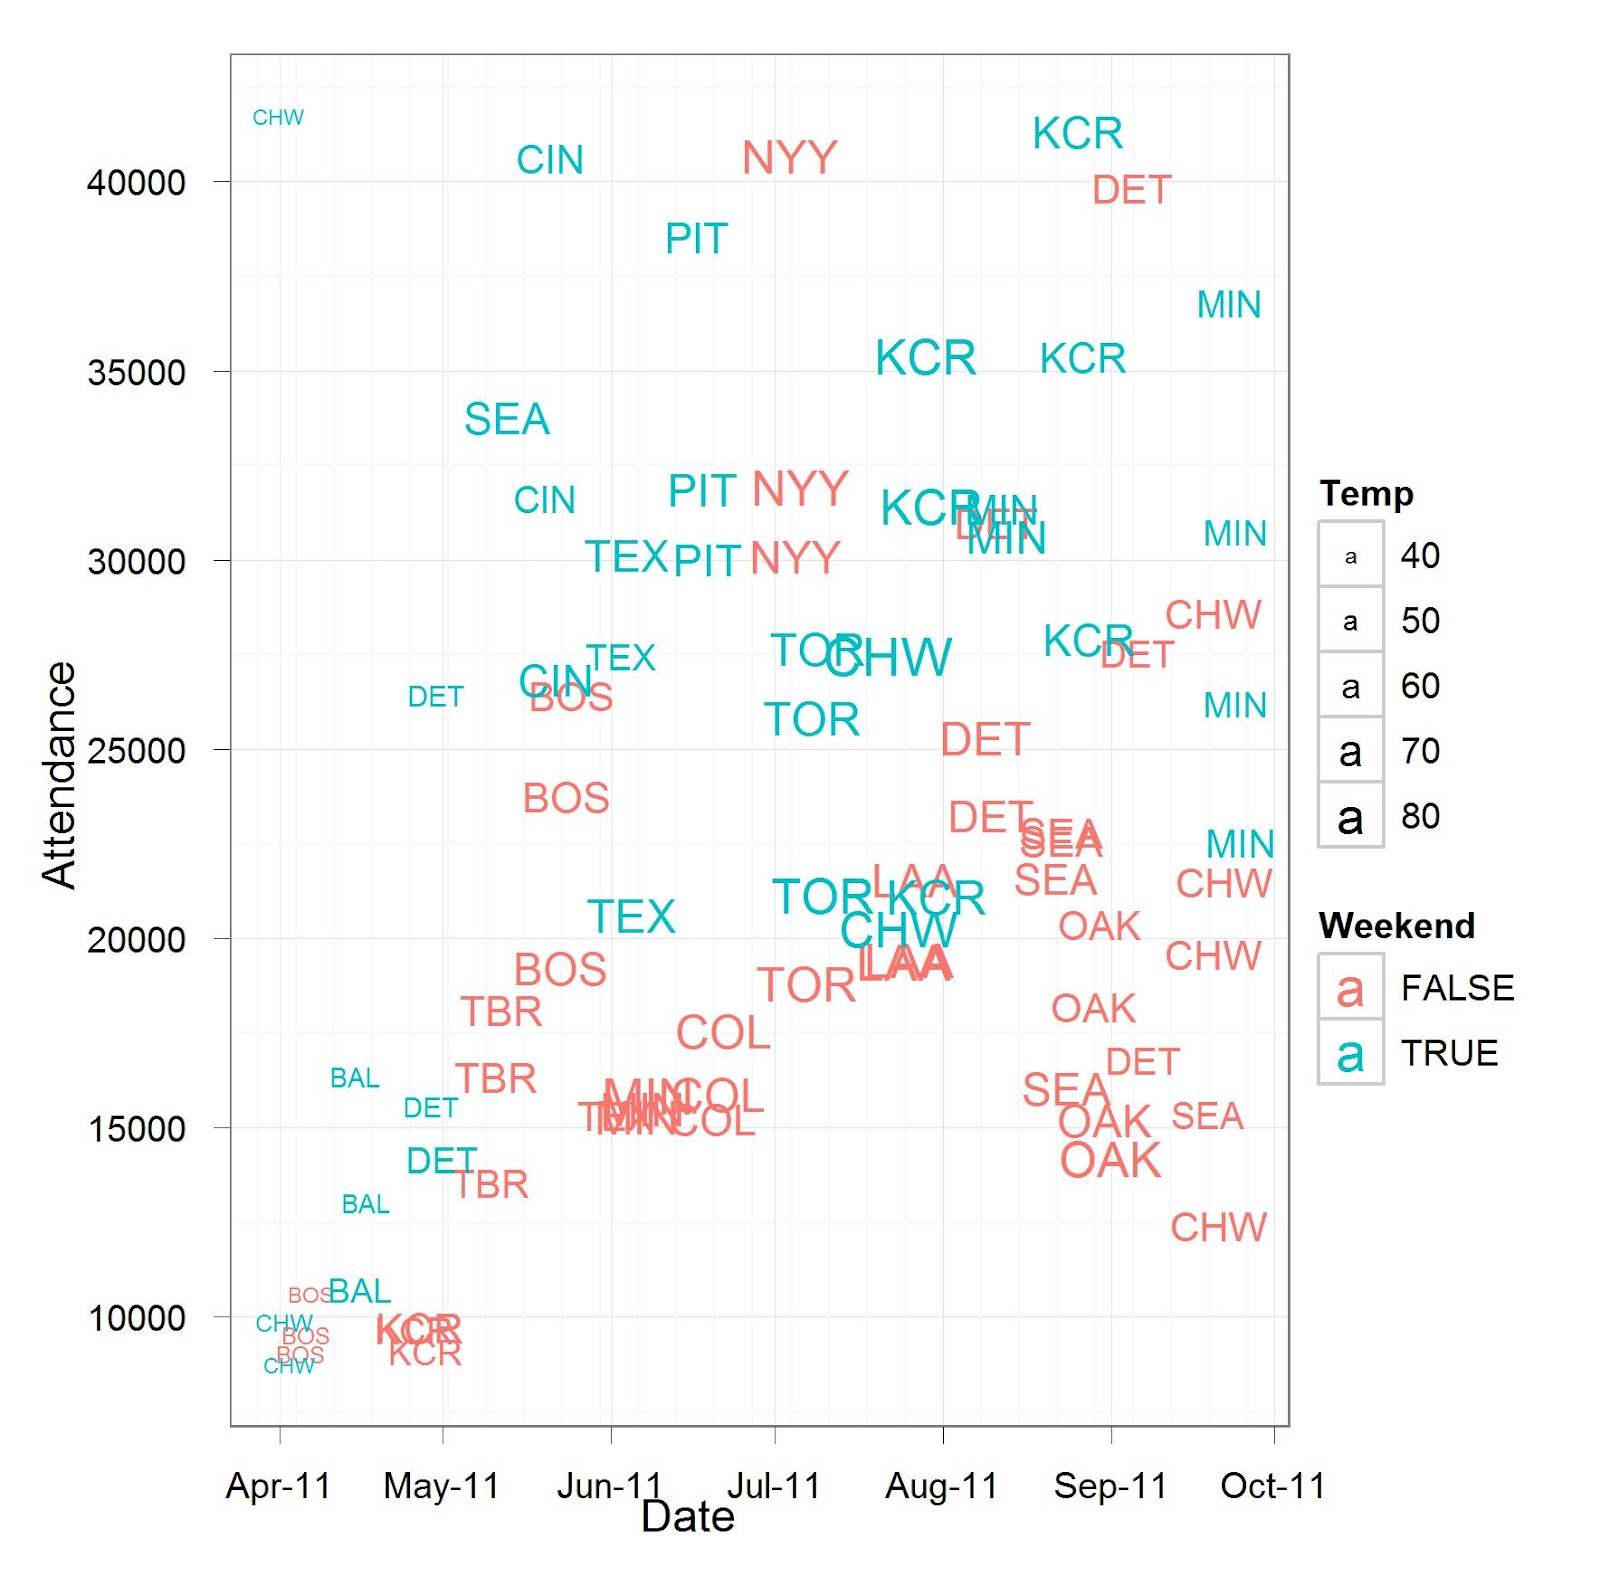
What I found to be significant (based on an exploratory approach) are summarized in the graph below. This plot explores the relationship of attendance with 5 other variables. I plotted attendance on the y-axis and the date on the x-axis. I don't expect date to have any effect, but it organizes other aspects well (and you can see opening day had the highest attendance of the year). Instead of plotting points, I plotted the name of the opponent. You can see there are some larger attendances when they are playing the New York Yankees and the Cincinnati Reds, for example. The color of the team name indicates whether they are playing on the weekend or not and the size indicates the temperature. Probably the biggest effect, weekend games outdraw weekday games consistently. The colder temperatures are only in the beginning of the season, and seem to have a noticeable effect (at least for the coldest days).
I also looked into how many games above .500 the team was and how close they were in the division race. Neither of these showed any correlation, at least at the marginal level. This is interesting because the main reason Chris Perez is frustrated is that the team is winning, so the fans should be supporting them. This shows that wining did not make much of a difference within a single year. This should be more prevalent over multiple years.
Some other information that might be useful is the quality of the opponent or whether the ace of the opposing pitching staff is starting. I only included temperature and not precipitation or any other weather information.
Here is the basic R code I used:
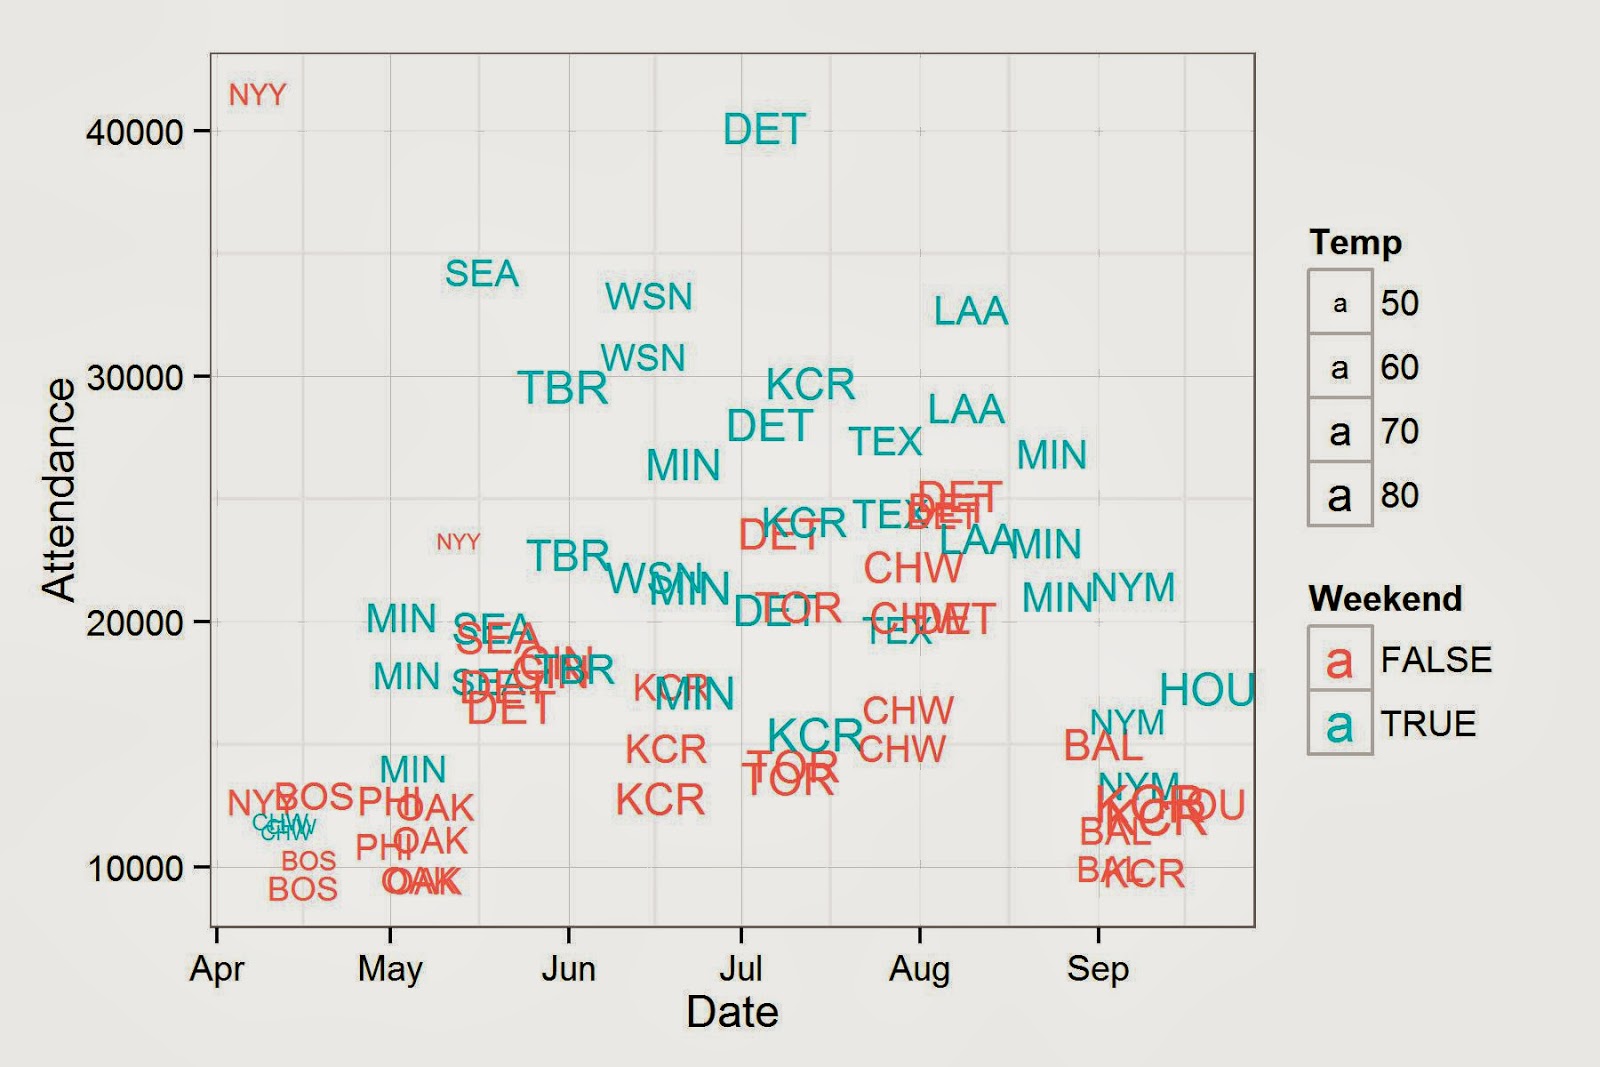
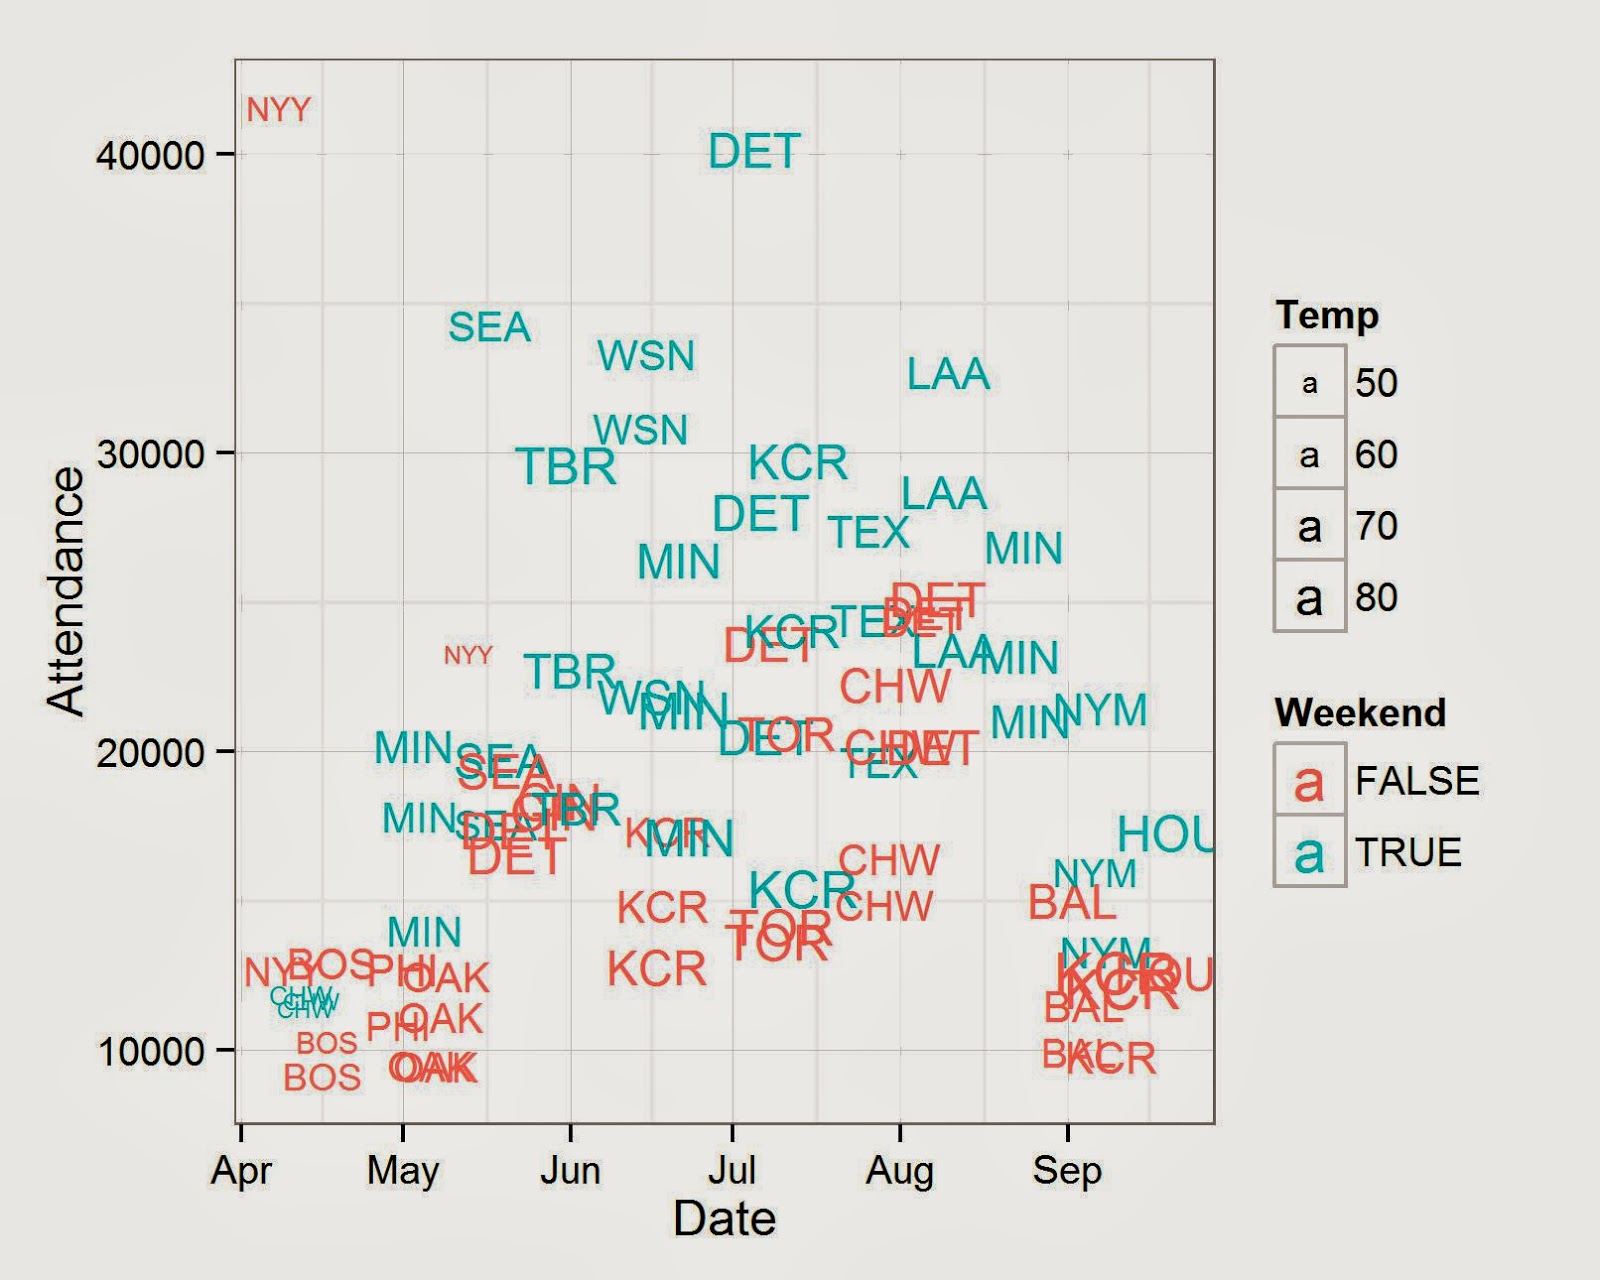
Since attendance is still a hot topic, I created the same plot for the 2013 season so far.
I looked at 2011 attendance data for the Cleveland Indians only. I had a strong suspicion that a popular opponent would definitely and weekend games cause attendance to increase. Also, there is usually some press at the beginning of the season that claims no one wants to go to the games because it is too cold for baseball. (There is also more competing entertainment at the beginning of the season.)
What I found to be significant (based on an exploratory approach) are summarized in the graph below. This plot explores the relationship of attendance with 5 other variables. I plotted attendance on the y-axis and the date on the x-axis. I don't expect date to have any effect, but it organizes other aspects well (and you can see opening day had the highest attendance of the year). Instead of plotting points, I plotted the name of the opponent. You can see there are some larger attendances when they are playing the New York Yankees and the Cincinnati Reds, for example. The color of the team name indicates whether they are playing on the weekend or not and the size indicates the temperature. Probably the biggest effect, weekend games outdraw weekday games consistently. The colder temperatures are only in the beginning of the season, and seem to have a noticeable effect (at least for the coldest days).
I also looked into how many games above .500 the team was and how close they were in the division race. Neither of these showed any correlation, at least at the marginal level. This is interesting because the main reason Chris Perez is frustrated is that the team is winning, so the fans should be supporting them. This shows that wining did not make much of a difference within a single year. This should be more prevalent over multiple years.
Some other information that might be useful is the quality of the opponent or whether the ace of the opposing pitching staff is starting. I only included temperature and not precipitation or any other weather information.
Here is the basic R code I used:
library(ggplot2)
ggplot(data=home.attend,aes(x=Date,y=Attendance,colour=Weekend,label=Opp,size=Temp))+
  geom_text()+scale_size(to = c(2, 5))+theme_bw()
Update (9/21/2013):
Since attendance is still a hot topic, I created the same plot for the 2013 season so far.
